CrusDe - Examples
[ Hekla lavas | Icelandic Rhythmics | disk load ]
The examples on this page show results of some of the research current or earlier versions of CrusDe were involved in. The presented problems themselves had a significant impact on CrusDe's design. It evolved while hunting for solutions and was improved when parallels between problems revealed themselves. CrusDe's design is flexible in a way that other problems in which Green's functions are involved can be adressed.
Currently supported data output formats are netCDF files or ASCII tables. Users can add specific formats. The maps were produced using The Generic Mapping Tools (GMT).
3. Hekla lavas
CrusDe was also employed to figure out whether it is necessary to discriminate between surface loads and internal pressure sources when deformation signals at volcanoes are investigated. The main results of this work are given in the slides above. Here I want to show off some more sophisticated results (the movies were created from the netCDF files by stiching the frames together; so far CrusDe doe not export to these formats -- plug-ins welcome, though!) :
- first 100 years of exponential transition from initial emplacement of the 1947 Hekla lava to final relaxed response:
model configuration | avi (1mb) | mp4 (308kb)
Vertical response is to the left, horizontal to the right, note different scales; time increases in yearly steps. - first 100 years of changes in displacement rates as Hekla 1947, 1970, 1980/81, and 1991 lavas are emplaced, using effective relaxation time of 100 years:
model configuration | avi (1mb) | mp4 (220kb)
Vertical response is to the left, horizontal to the right, note different scales; time increases in yearly steps. Note that the flickering is the moment of emplacement of a new flow. The displacement rate is enormous for the instantaneous response! - Model configuration files for the GRL 2010 paper (submitted):
- Model for best fitting central subsidence (H was incremented by 0.5 km from 1 to 10 km, 3.5 km is best fit): model configuration
- Model for best fitting effective relaxation time (tr=100 yrs, see videos above): model configuration
- Used lavas: load files
2. Icelandic Rhythmics: Deformation due to annual snow load changes
Here we used CrusDe to investigate a possible correlation between annual snow load changes on Iceland's ice caps and a sinusiodal deformation signal found in the record of continuous GPS stations (see Figure 2.1. The details are discussed in the related article.
We assumed an irregular load characterized by the outlines of Iceland's major ice caps on top of a flat elastic halfspace. Snow loads were given as snow equivalent water load and assumed to be distributed equally over the ice caps (that results in deformation over-estimates in the near field). The load history, i.e. the change of the load height over time, is a simple sinusiodal function that's the same for all loads (melting and snow accumulation assumed to be in phase for all ice caps, mildly simplified). The snow depths are maximum at about mid-May which was translated to day 140 of the year. The respective configuration file for CrusDe can be found here.
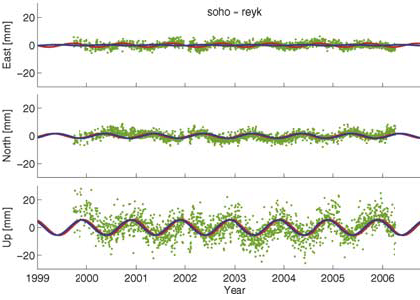
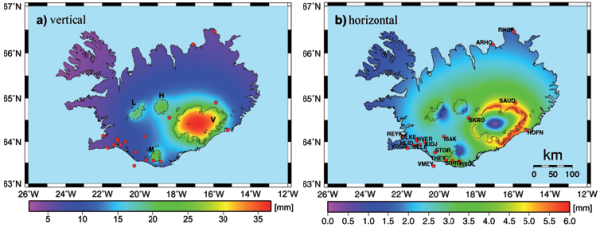
Results for one CGPS site (SOHO, closest to the major ice caps) is shown in Figure 2.1. We minimized the misfit of the model by doing a grid search over the Young's modulus for all sites. The best value for the effective Young's modulus of all of Iceland turned out to be approx. 40 GPa. Figure 2.2 shows maps of absolute vertical and horizontal peak-to-peak displacement due to maximum snow load for all of Iceland.
1. Response to a disk load
To verify the implementation a disk load can be placed
on the surface and its response compared to analytic solutions at specific points.
The image below shows the response of an elastic half-space to a disk load applied to the surface. The Young's modulus
and Poisson's ratio of the half-space are set to 10 GPa and 0.25, respectively. The disks parameters are set to
height h = 150 m, radius R0 = 2 km, and density
ρ = 1000 kg m-3.
Its center is at x = y = 5000 m. The respective
configuration file for CrusDe can be found here.
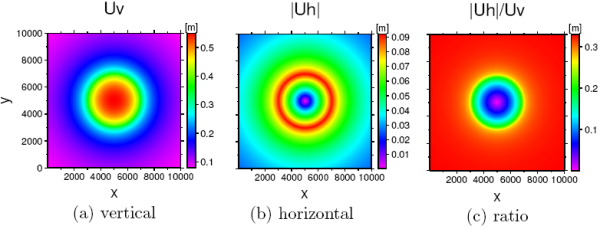
An analytic solution exists for the disks center with Uv = 0.54 m and Uh = 0 m. Following
Pinel et al. [2007] the ratio |Uh| / Uv will never exceed 1/3 for in an elastic half-space with the
chosen Poisson's ratio. Apparently the presented implementation meets these criteria.