New Mexico Tech
Earth and Environmental Science
ERTH 401 / GEOP 501 - Computational Methods & Tools
Lab 11: Adobe Illustrator
Now that you've been working with various tools to analyze data and generate "research-quality" figures from Python, Matlab, etc., it's time to think about how to transform these figures into "presentation-quality". We'll be covering Adobe Illustrator this week, graphics software available for Macs and PCs (but not Linux). There are other tools out there, such as Photoshop, Canvas, and InkScape (Inkscape is open-source, free, and for Linux as well as Mac and PC).
Adobe Illustrator is available in MSEC 345 on the Macs, so we'll stagger the lab attendance so that each student has an opportunity in the lab time to get experience while we're also in the lab. The software is also available on other machines in MSEC and across campus. Please be aware of the number of seats as you try to finish your lab in the next week.
Deliverables for this lab will be figures generated for each task.
Task 1:
At some point, you will need to create a figure from scratch, starting with the blank page. A good example of this - an introductory figure to motivate your thesis and/or grad seminar talk. A good introductory figure might be something like a schematic or cartoon-style drawing of a volcano, figure showing where earthquakes occur on a plate boundary, a stratigraphic column of your field area. Use Adobe Illustrator to create this figure and turn in the result as the deliverable for Task 1.
Task 2:
Now that you've had a little practice with Illustrator, we are going to integrate our generated Python figures with Illustrator. Go back to Lab 5 deliverable 4d and 4e and instead of showing the figure, save them as png files.
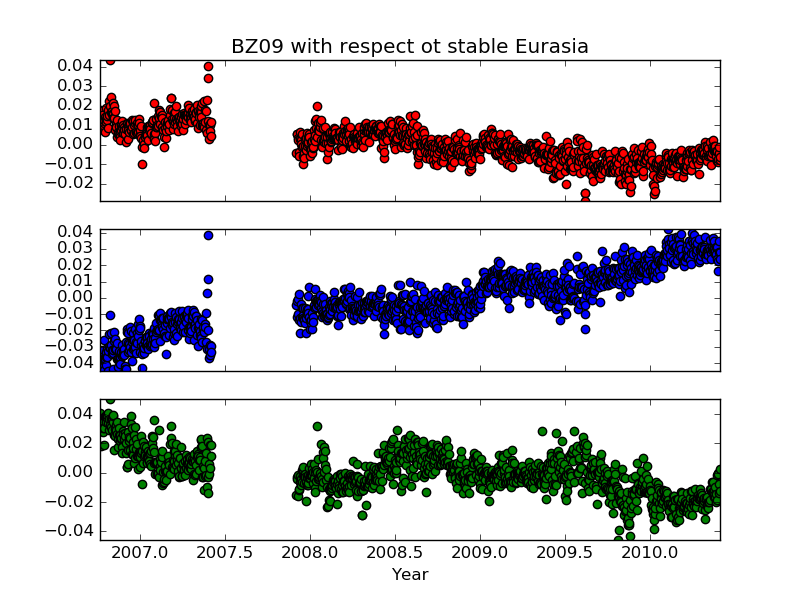
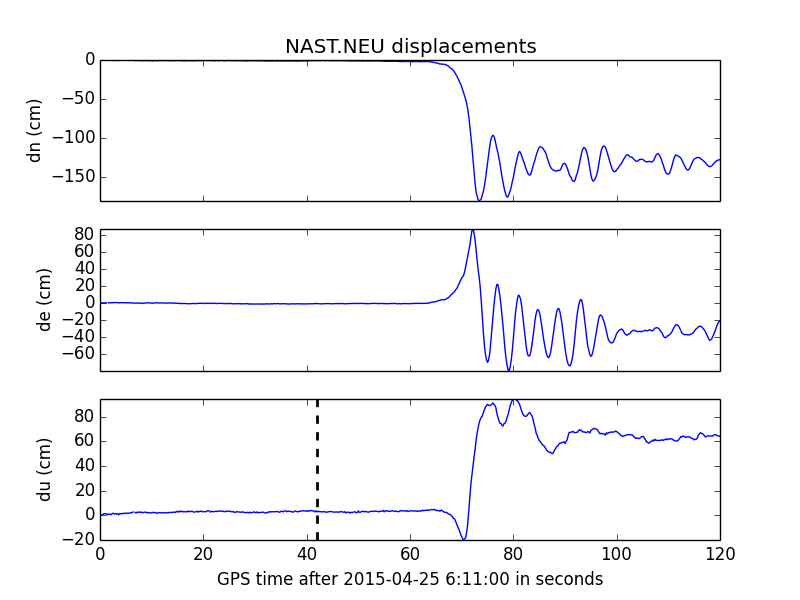
Now import them to illustrator as two separate images. Add a label explaining the gap in figure 4d. Add a mainshock label to figure 4e. Add a figure caption at the bottom of each figure. Submit your modified images as Deliverable2a and Deliverable2b.
Try to select individual items (such as dots, or axes labels) within the figure (like a data point). Can you do this? This is a thought experiment (no need to write down an answer) - think about why or why not. The answer will be very important if you want to edit files you create figures in other programs.
Task 3:
Go back to Lab 5 deliverable 4d and 4e and save them as PDF or postscript files. Import them to illustrator as two separate images and do the following:
A) Remove the white background from both figures and resize the artboard to the image boundaries (in Illustrator, you can do this by going to Objects > Artboards > Fit to artwork bounds).
B) Change the color of the tick and axes labels, and the panel boxes to gray.
Submit your modified images as Deliverable3a and Deliverable3b.
Task 4:
We will be covering GMT in the upcoming lectures/labs, so you will get an opportunity to generate your own figures in that software later. But for now, download the following figures:
Central America (.ps) | Nicaragua (.ps)Alter these in Illustrator through the following:
1) Create a new document and copy both of these maps into that new document to make a 2 panel figure.
2) Based on the geographic bounds of the regional map, place a small box on the larger that indicates the location of the regional map.
3) Add reasonable labels to the figures (things like a) and b) for each panel) and a figure caption.
rg <at> nmt <dot> edu | Last modified: November 07 2017 15:28.